Power BI decision experiences
Executive dashboards, scorecards, drill-through pages, semantic models, and recurring readouts can turn scattered data into clear business action.
Portfolio
This portfolio shows how dashboard design, semantic modeling, Dataverse-backed structures, and governance practices can turn enterprise data into operating systems for leaders. The examples highlight capabilities I built or co-led: executive reporting, value measurement, KPI and OKR governance, mobile experience scorecards, and product prioritization intelligence.
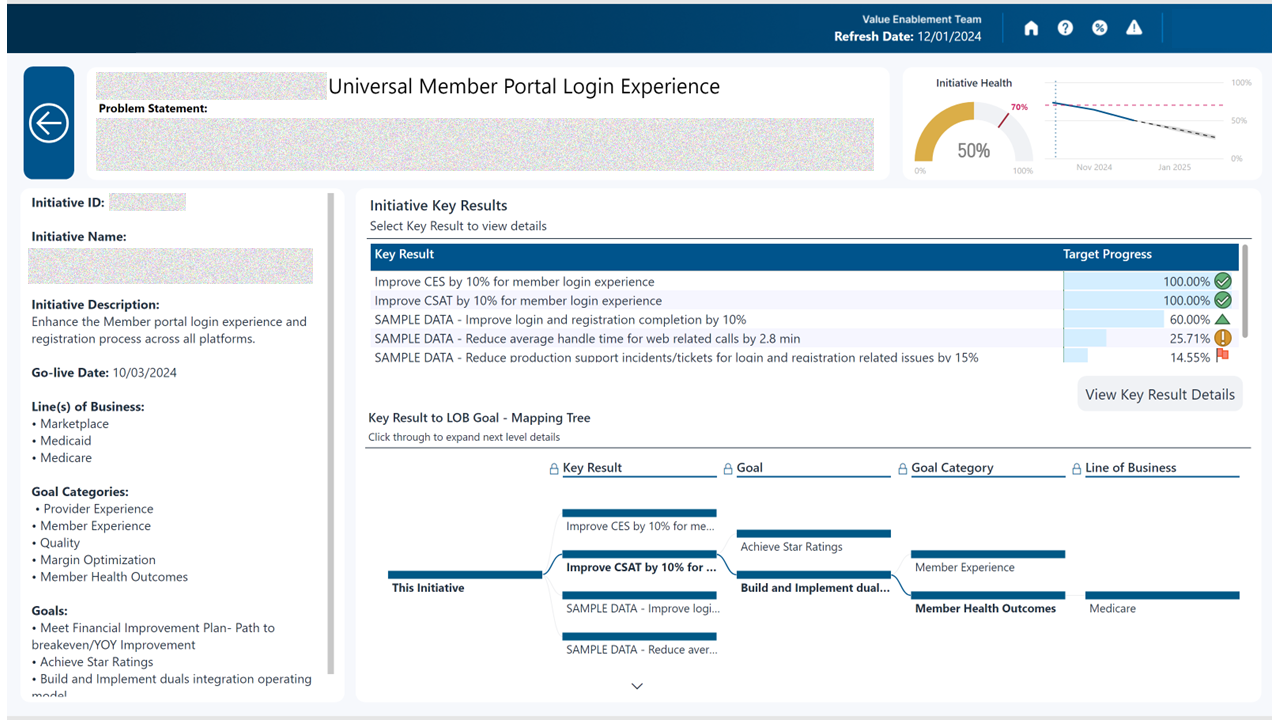
Solution Approach
Executive dashboards, scorecards, drill-through pages, semantic models, and recurring readouts can turn scattered data into clear business action.
Dataverse structures, governed records, Power Apps patterns, and workflow-ready data capture can connect measurement with execution.
KPI definitions, OKR alignment, value tracking, and review processes can help leaders understand whether strategy is producing measurable outcomes.
Selected Case Studies
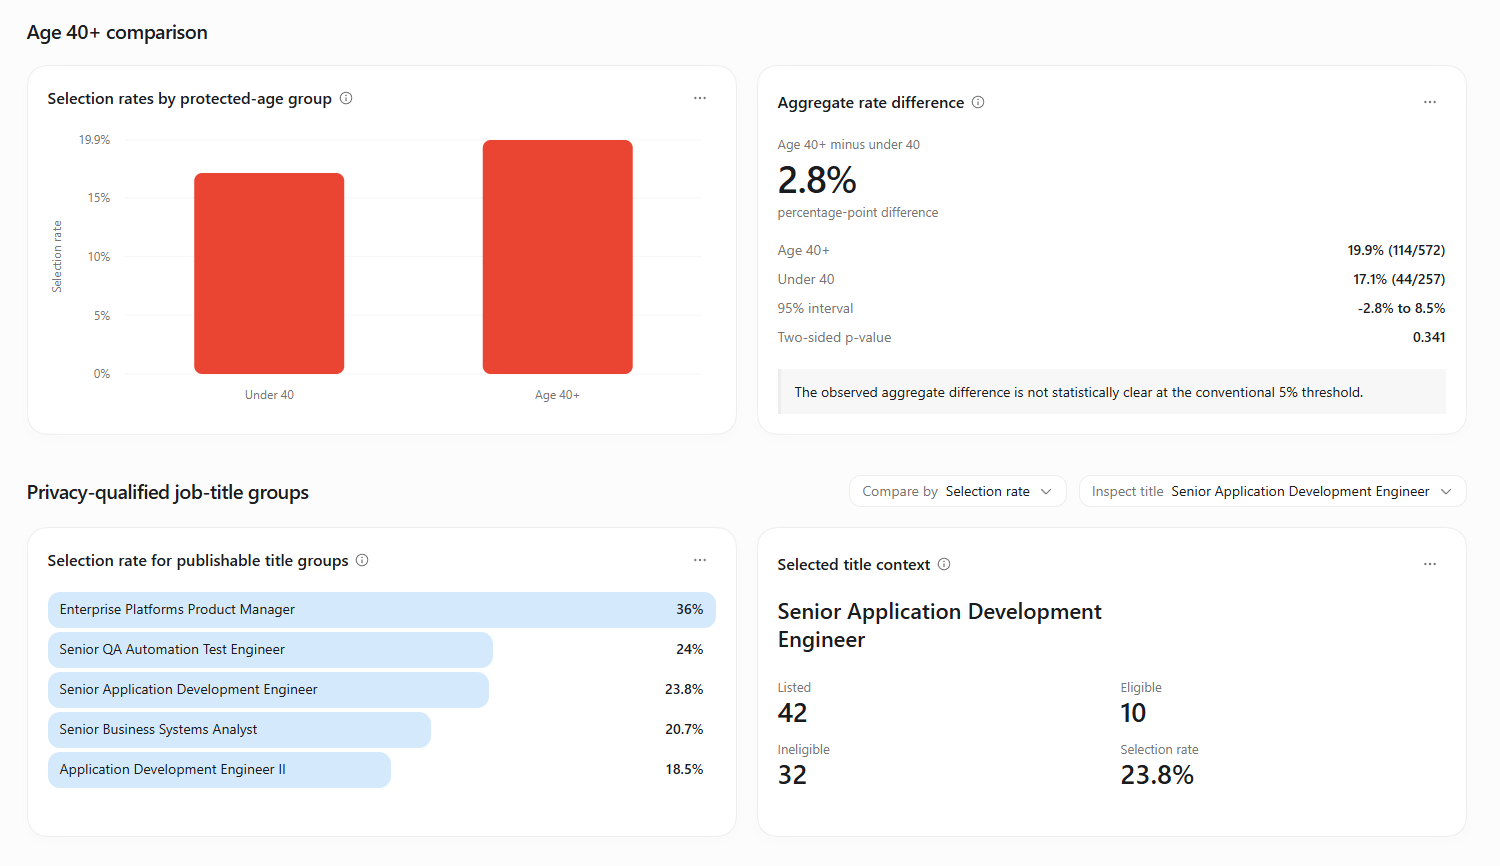
Data engineering and analytical storytelling
A privacy-conscious interactive dashboard built from a structured workforce disclosure.
Following a recent reduction in force at an organization I was associated with, I received an OWBPA disclosure describing the affected population. I used it to build a meaningful interactive dashboard that helped me understand the scale of the action, how outcomes varied across age bands and qualifying job-title groups, and what the aggregate data could and could not establish. I transformed the 20-page disclosure into a reconciled analytical dataset, then designed a public-safe experience that preserves useful comparisons without exposing employee-level records.
829
Source records reconciled
144
Exact source titles
16
Public aggregate rows
Reconciled 829 mutually exclusive records to the disclosure totals before calculating any metrics.
Added interactive age-band, comparison-metric, and privacy-qualified job-group controls.
Excluded exact ages, employee-level rows, source pages, unique roles, and small comparison groups from the public experience.
Confidentiality note: Screenshots and examples in this case study were anonymized for confidentiality purposes.
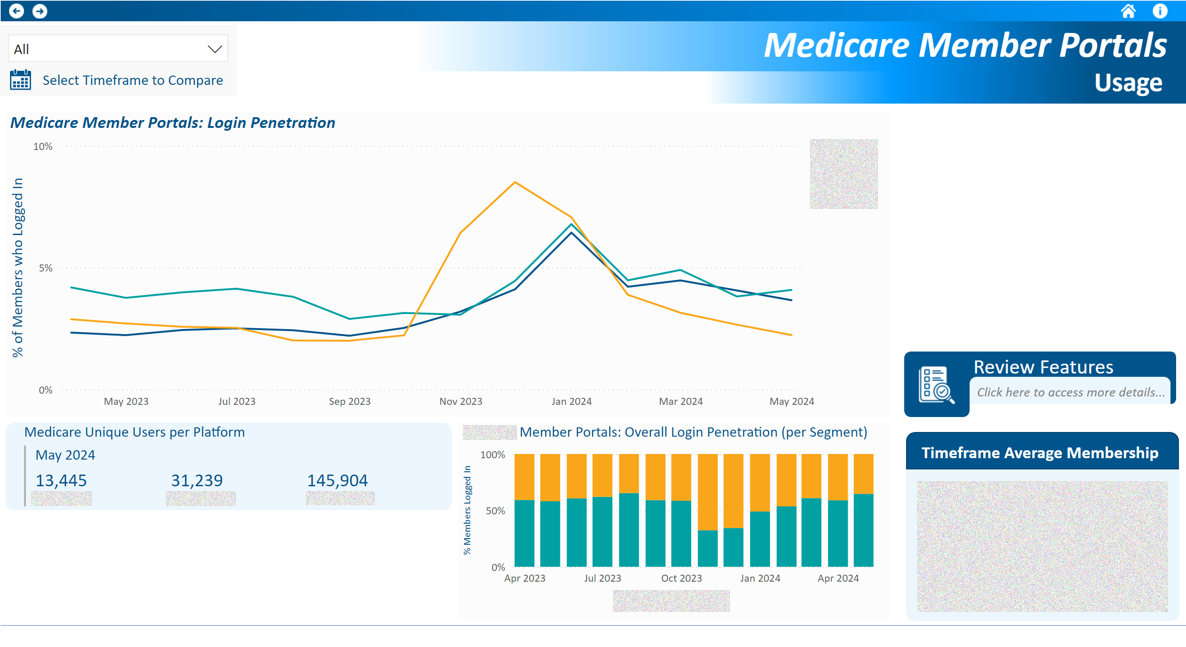
Power BI executive reporting
A Power BI reporting solution that turned channel activity into a reusable operating view for leadership.
Built a Power BI reporting experience that brought usage trends, audience scale, and feature performance into one executive readout. The solution showed how Power BI can create recurring business intelligence, align multiple digital journeys, and help leaders compare adoption signals before deciding where to focus.
20M+
Members represented in reporting scale
10
Digital channels and product lenses
Monthly
Power BI leadership cadence
Modeled engagement and login activity across digital touchpoints so leaders could track adoption consistently.
Used Power BI visuals, slicers, and trend views to compare performance across portals, usage cohorts, and timeframes.
Turned static reporting into a repeatable decision process for product, operations, and executive reviews.
Confidentiality note: Screenshots and examples in this case study were anonymized for confidentiality purposes.
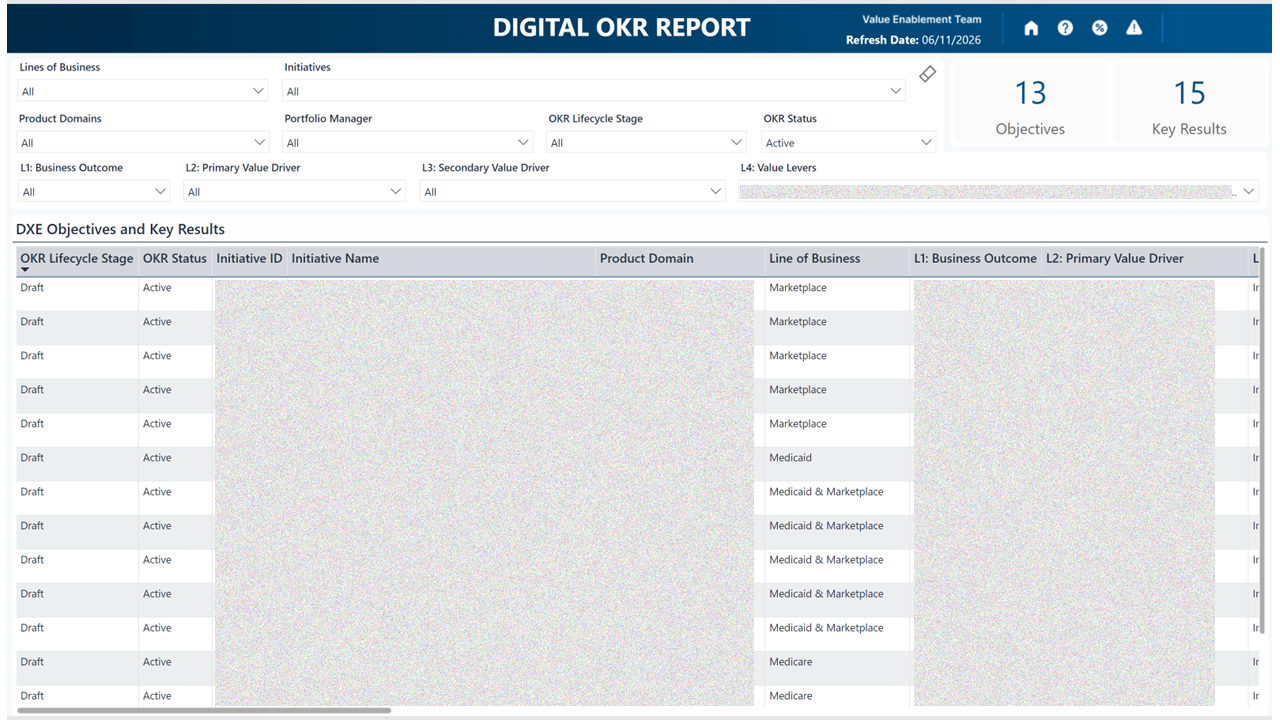
Power Platform value system
A Power BI and Power Platform capability connecting objectives, initiatives, KPIs, and value evidence.
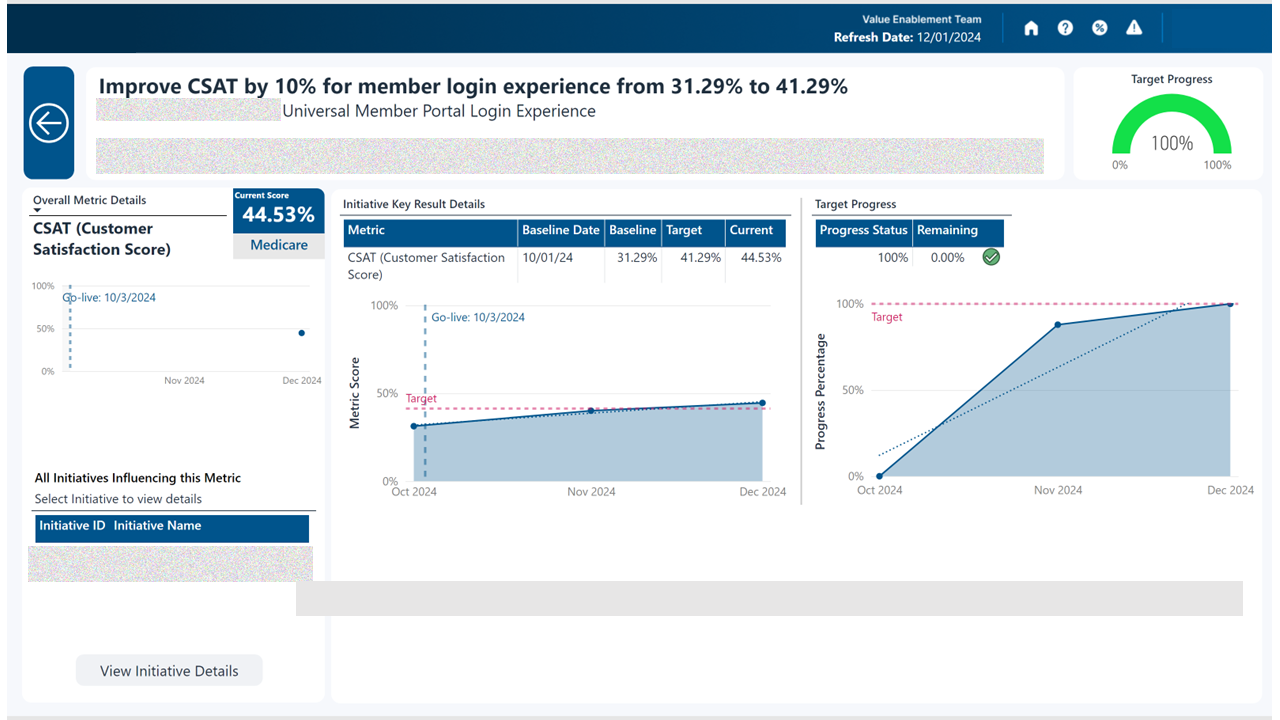
Co-led a Power BI and Power Platform solution that connected OKRs, product initiatives, KPI definitions, target progress, and value evidence. Using Dataverse-style structures and governed reporting patterns, the framework made strategy measurable and gave leaders a consistent way to review initiative health, ownership, and impact.
13+
Initiatives organized into one view
70+
OKRs governed through the framework
30+
Portfolio KPIs defined and structured
Connected strategic objectives, key results, value levers, product domains, and supporting KPI evidence.
Used Power BI dashboards with Dataverse-backed data structures to support governed visibility and drill-through.
Created an operating system where portfolio leaders could review progress, risk, and value from the same source.
Confidentiality note: Screenshots and examples in this case study were anonymized for confidentiality purposes.
Power BI scorecard design
A Power BI scorecard for engagement, satisfaction, retention, and self-service outcomes.
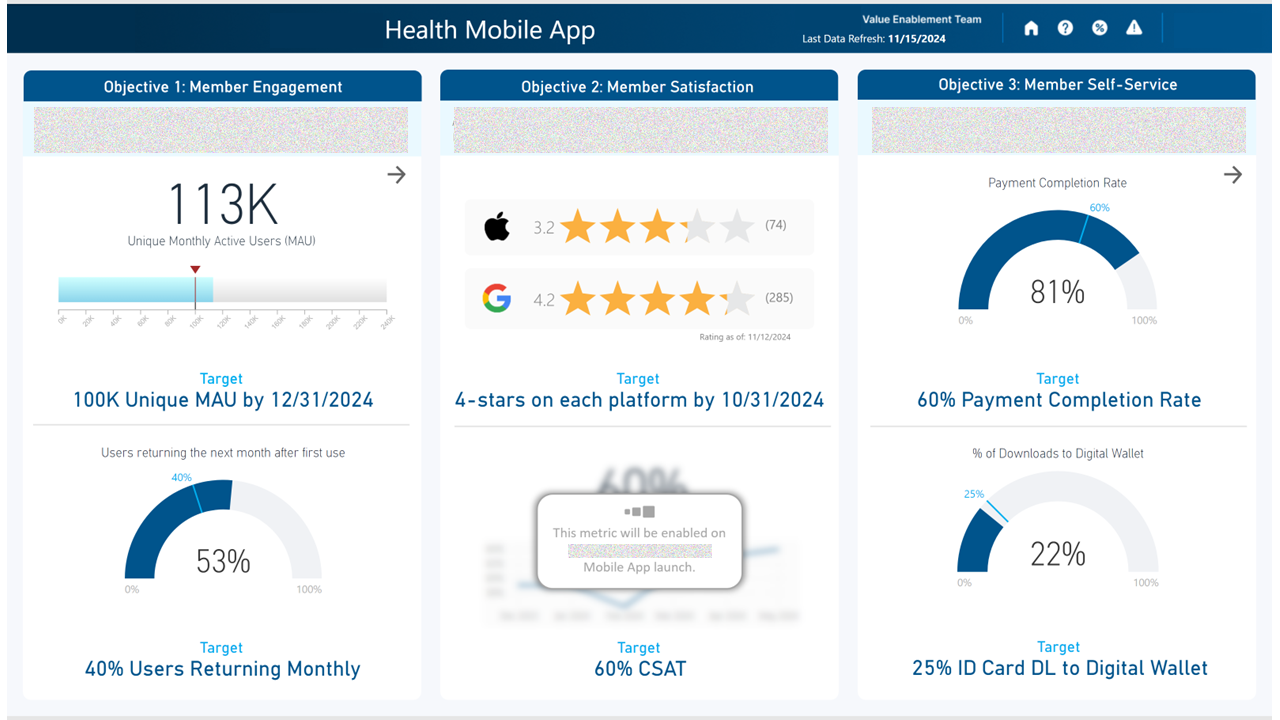
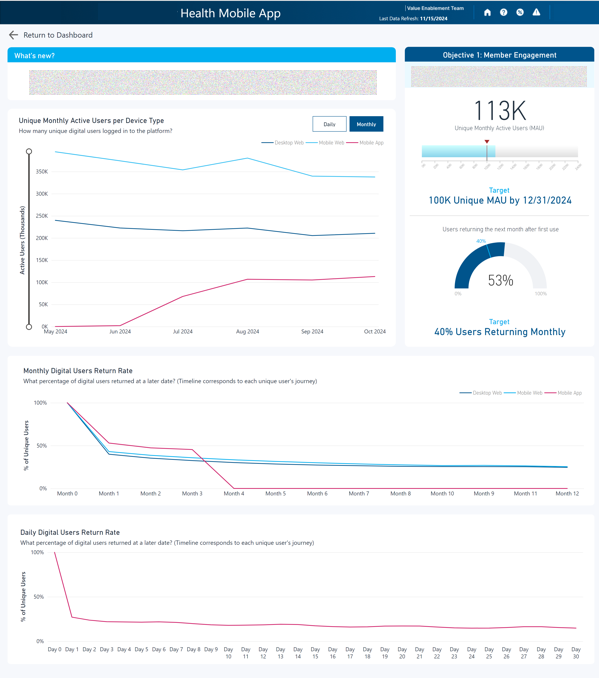
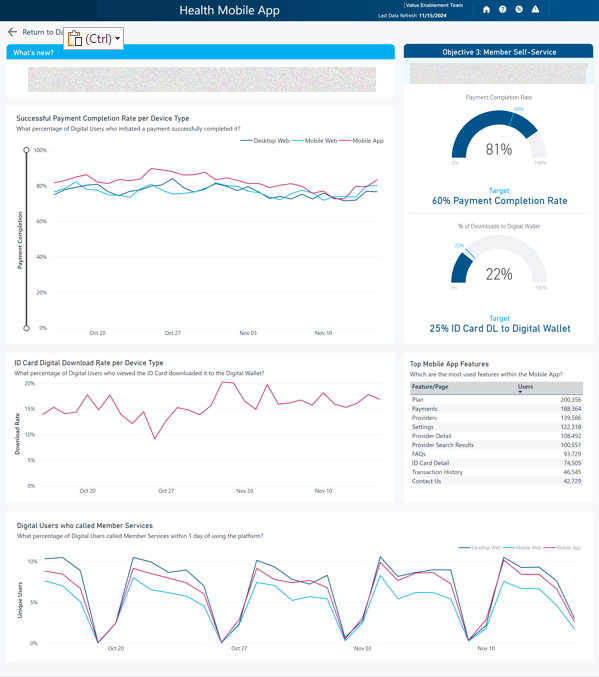
Designed a Power BI scorecard that translated mobile app performance into objective-level measures and target progress. The experience showed how Power BI can blend executive summary pages with drill-through detail views so leaders can move from what happened to where action is needed.
3
Objectives tracked
6
Target-linked KPIs
CX
Primary performance lens
Organized engagement, satisfaction, retention, payment completion, digital wallet, and feature-use signals into one scorecard.
Built detail pages that gave product teams diagnostic context behind each objective.
Made progress against targets visible without overloading the leadership view.
Confidentiality note: Screenshots and examples in this case study were anonymized for confidentiality purposes.
Power BI prioritization intelligence
A planning view that connected adoption, friction, value, and initiative context.
Created a Power BI view that linked adoption signals, customer behavior, friction points, and initiative context to support planning decisions. The solution demonstrated how Power BI can connect KPI progress, product telemetry, and stakeholder questions into a practical prioritization workflow.
8
Feature groups compared
4
Decision inputs aligned
PI
Agile planning cadence supported
Combined adoption trends, behavior patterns, target progress, and operational context into one planning view.
Supported prioritization by making tradeoffs easier to compare across feature groups.
Helped stakeholders move from dashboard observations to product decisions and backlog conversations.
Confidentiality note: Screenshots and examples in this case study were anonymized for confidentiality purposes.
Capabilities
Power BI can provide shared definitions, role-aware reporting, drill-through decision paths, and executive-ready storytelling.
Power Platform can connect data capture, Dataverse records, low-code apps, approvals, and analytics into one managed ecosystem.
Together, they help teams move from reporting activity to governing outcomes, prioritizing work, and measuring value.
Strong adoption comes from the process around the tool: stakeholder alignment, metric ownership, change management, and reusable review practices.
Career Brief